 notes.uart.sh
Just Dump All The Registers, or: last-ditch troubleshooting with /dev/mem
dealing with low level platform or kernel code? not sure why something is broken? tired of sifting through vendor drivers? just dump all registers in downstream and mainline and diff them. 2 massive text files with tons of hex values. you will certainly not regret dumping every single register
An interesting method of reverse-engineering involving drivers that I've become quite fond of is to just dump all the registers.
A device that is being controlled by a driver typically has some kind of registers that store configuration values, be it over MMIO (as it is with SoC components) or via I2C or a similar bus.
It turns out that the values of these registers can very often be dumped from userspace!
- For MMIO, there's the
/dev/meminterface, which can be enabled withCONFIG_DEVMEM(there's alsoCONFIG_STRICT_DEVMEM). You can use thedevmem(part of busybox) ordevmem2(external utility) command line utility to read or write to almost any memory address, hardware permitting. - For I2C, there's
i2cgetandi2csetfromi2c-tools.
I wrote a set of tools for dumping registers into a specific file format I call the dump format or dumpfmt (very creative, I know…). The resulting files look something like this:
fmt dump
type mmio
base_addr 0x34000000
size 0xed4
addr_bits 32
val_bits 32
--- header_end ---
0x34000000 0x00000000
0x34000004 -
0x34000008 0x02020000
0x3400000C 0x00000004
I use those tools to do a dump on a known working/vendor kernel, then do another dump on a broken/mainline kernel.
That same repo contains a tool that can take two dumpfmt files and diff them in an HTML interface:
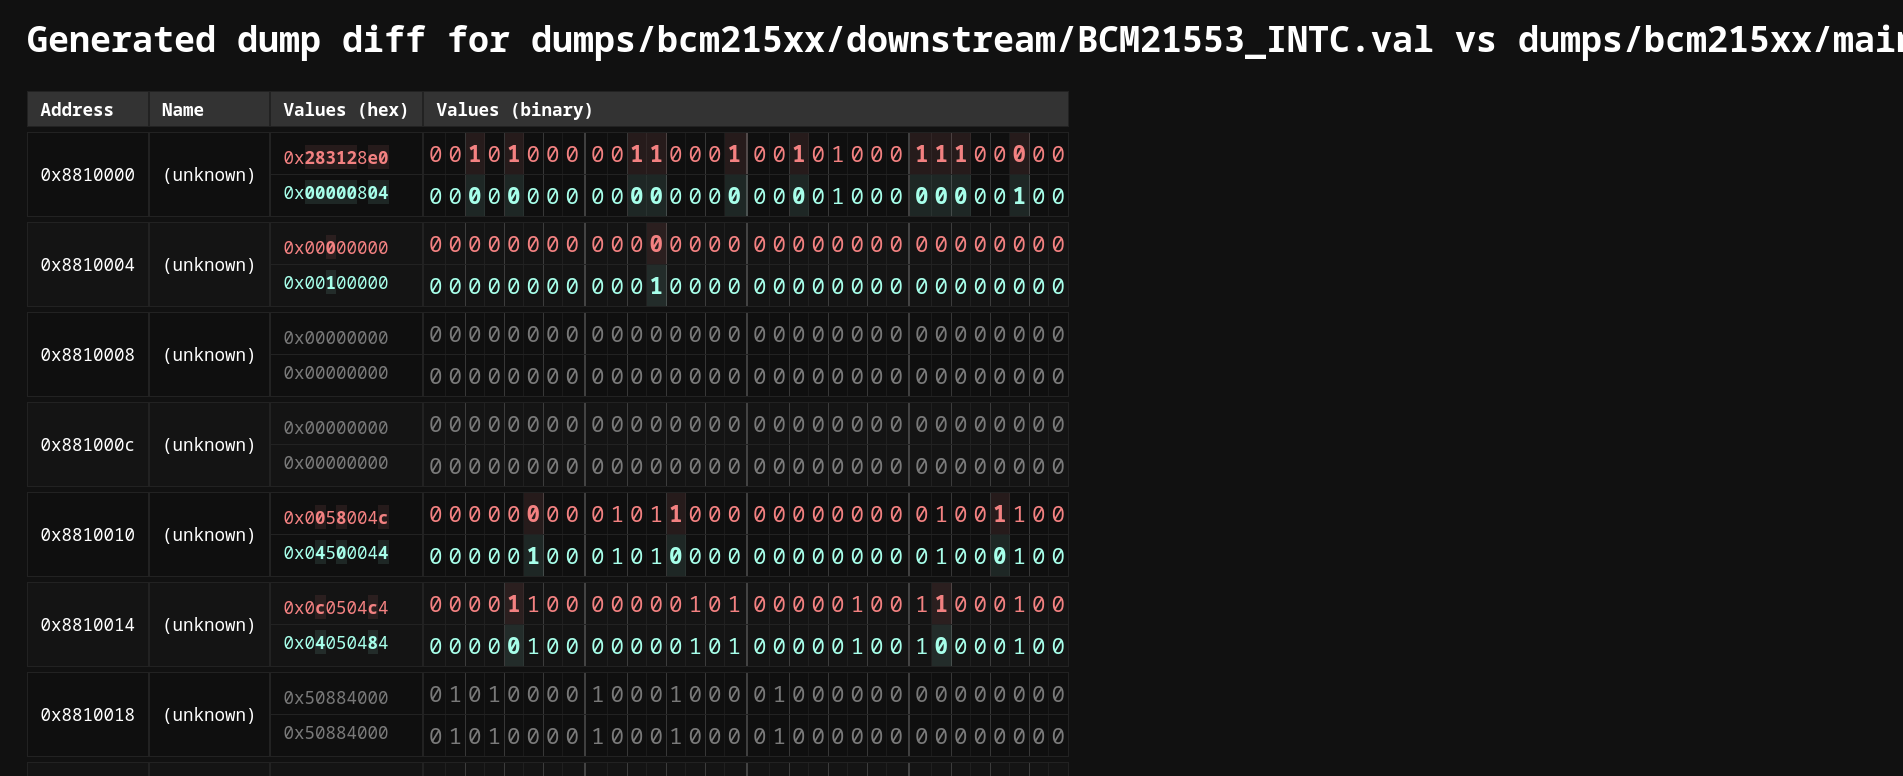
Just looking at raw values is a bit annoying though, so the diff tool also supports documentation. A separate doc format, or dfmt, can be used to describe hardware:
fmt doc
type mmio
base_addr 0x0000f000
size 0x400
addr_bits 32
val_bits 8
--- header_end ---
0x0000f004 ADDR_NAME
! Description

  b 0 0 BIT_NAME
  ! Description for bit 0

  b 1 2 BIT_NAME
  ! Description for bit range 1-2 (inclusive)
  ! Descriptions can also be multiline.
(Besides the doc format, it can also automatically parse RDB headers included in Broadcom Kona vendor kernel releases, which are Broadcom-specific files that contain names and bit ranges used in all the registers (no descriptions, but we do get names!).)
This lets me preview individual values/fields encoded in the overall values, which makes analyzing the diffs and comparing drivers much easier.

(This screenshot also shows the dump viewer - another helper script that allows me to preview a single dump, rather than a diff of two dumps, with the same nice bit range showing support.)
The moral of the story is - dumping registers is a very effective way to quickly figure out hardware configuration differences. Feel free to use my scripts - I tried my best to document them so that other people can use them. Everything's in the refractionware/reveng repo.